For this assignment I followed Daniel’s approach using BeautifulSoup to create a list of network edges (sources: article ID, target: geographical location) usable for Gephi:
from bs4 import BeautifulSoup
import re
import os

newPathToFolder = "D:\\Perseus_DATA\\"
pathToFolder = "C:\\Users\\Siming\\Desktop\\PERSEUS2\\Perseus_XML_ORIGINAL\\"
listOfFiles = os.listdir(pathToFolder)

# function with one argument filter to define a specific date which will use values of the dispatch only if the date is true
def generate(filter):

    placeNames = []
    dicFreq = {}
    resultsCSV = []

    # for loop to access all files
    for f in listOfFiles:
        soup = BeautifulSoup (open(pathToFolder+f, "r", encoding="utf8"), features="html.parser")
        # searches for list items of "date" and return maximum two elemens
        issue_date = soup.find_all("date", limit=2)[1] # only returns the second match
        issue_date = issue_date.get("value")
        # searches for all tags with "div3" and stores it in variable "articles"
        articles = soup.find_all("div3", type = True)
        if issue_date.startswith(filter):
            for a, item in enumerate(articles):
                counter = str(a) + "-" + str(issue_date)                        # for loop that counts each article and combines it wit the date in the dispatch
                places = item.find_all("placename", key = True)                 # continues to find all placenames with an attribute
                article = "article-" + counter                                  # variable that holds the issue date of the dispatch a string and an article counter
                print(article)
                for a, item in enumerate(places):
                    counter2 = str(a) + "-" + counter                           # counter2 will be the unique identifier ID for each row
                    place = item.get_text()                                     # for loop to retrieve all placenames as value from the placename tag
                    key = item["key"].split(";")                                # variable that holds the tgn number
                    print(str(place))

                    for k in key:
                        key = [d for d in k if d.isdigit()]                     # for loop to clean tgn numbers digits only
                        tag_id = ''.join(key)
                        placeList = "\t".join([counter2,issue_date,article,place,tag_id])        # creating a variable that holds each result article, place, tag_id
                        placeNames.append(placeList)                            # appending the variable to a list

    for i in placeNames:                                                        # creating a frequency with a for loop for all placenames
        if i in dicFreq:
            dicFreq[i] += 1
        else:
            dicFreq[i]  = 1

    for key, value in dicFreq.items():                                          # removes all placenames that are mention once only
        if value < 2: # this will exclude items with frequency higher than 1 - we want unique rows
            newVal = "%09d\t%s" % (value, key)
            # newVal will looks like: `000005486 TAB Richmond`
            resultsCSV.append(newVal)

    resultsCSV = sorted(resultsCSV, reverse=True)                               # sorting the results variable
    print(len(resultsCSV)) # will print out the number of items in the list
    resultsToSave = "\n".join(resultsCSV)                                       # joining the results line by line

    # creates a new file in a target folder with name + article counter + name + issue_date + txt file
    newfile = newPathToFolder  + "1864-04-13_network.csv"
    # creating a header for the final file
    header = "freq\tid\tdate\tsource\ttarget\ttgn\n"
    # opens the newfile and writes each article into a sperate file
    with open(newfile, "w", encoding="utf8") as f8:
        f8.write(header+"".join(resultsToSave))

# how to use the function
generate("1861-04-13")
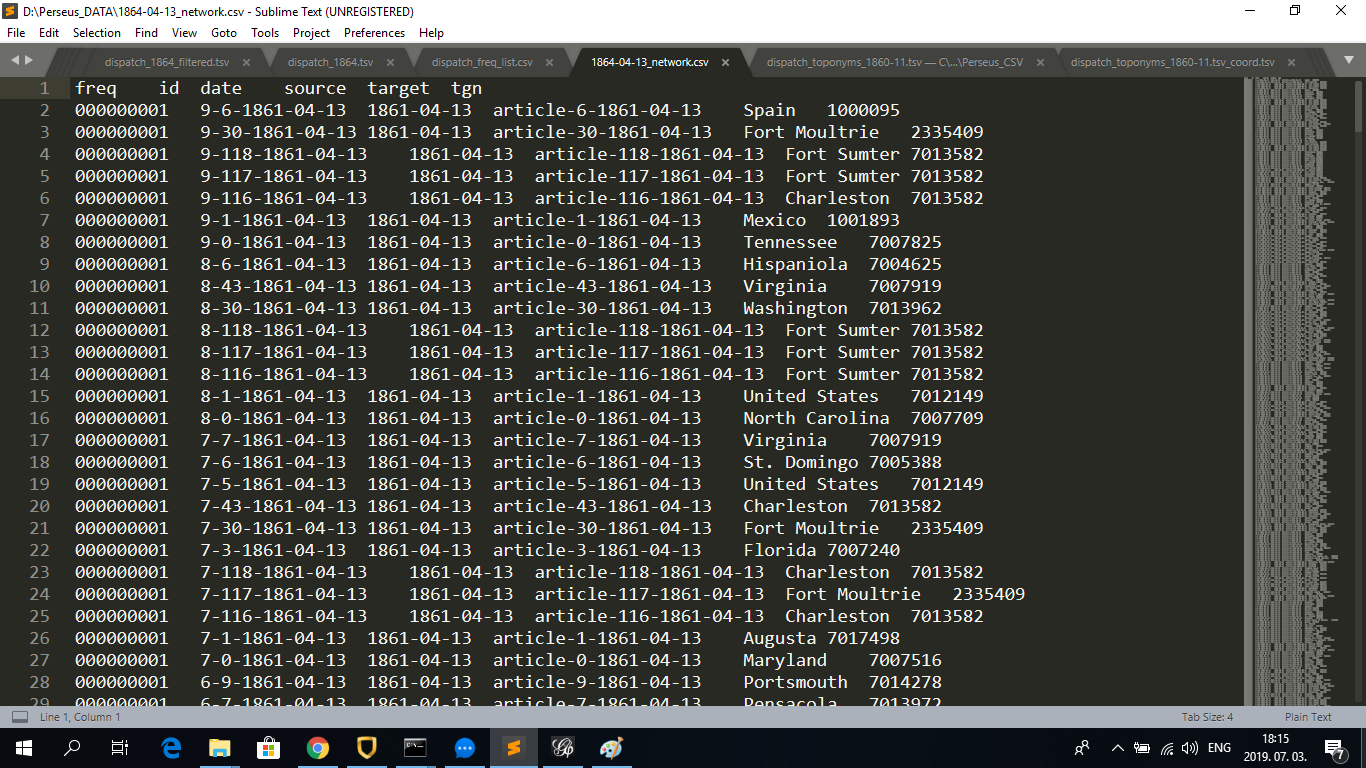
As Daniel noted, it even the processing of one month of Dispatch data was a hard task for Gephi, therefore I narrowed down the time frame for the single day of April 13th, 1861. This was the day after the outbreak of the U.S. Civil War (1861-65). Since in the age of printed media most news were published the day after events occurred, I assumed that most reports on the outbreak of the Civil War were published in this issue of the Dispatch, making it an interesting target of network analysis. The same procedure can be repeated for any year, month or day (see my explanation for the assignment for class 11. The resulting CSV file looks like this:
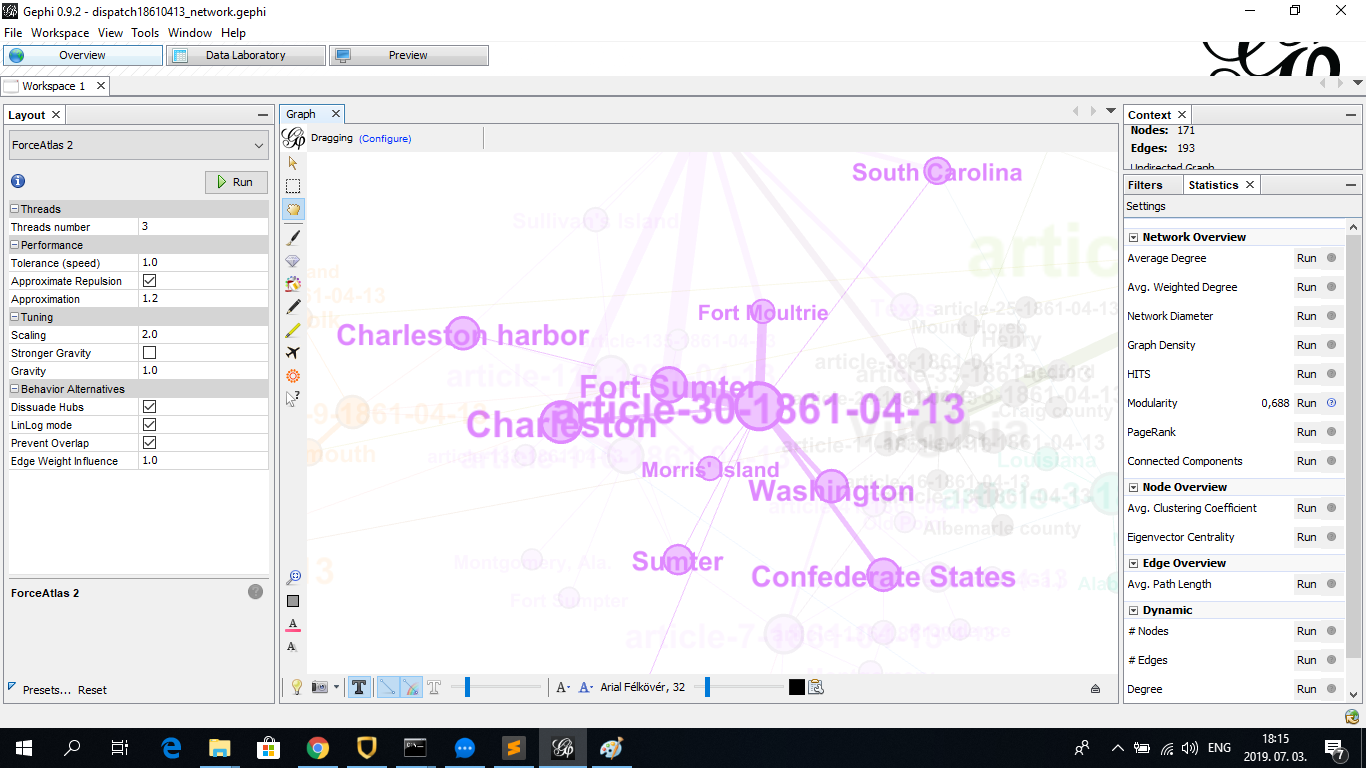
I imported the file into Gephi, made the necessary settings practiced during the class (copying nodes ID column into label column, choosing “Force Atlas 2” layout, setting
labels to be displayed, displaying node size based on degree, running “Modularity” to create color-coded clusters), resulting in the following:
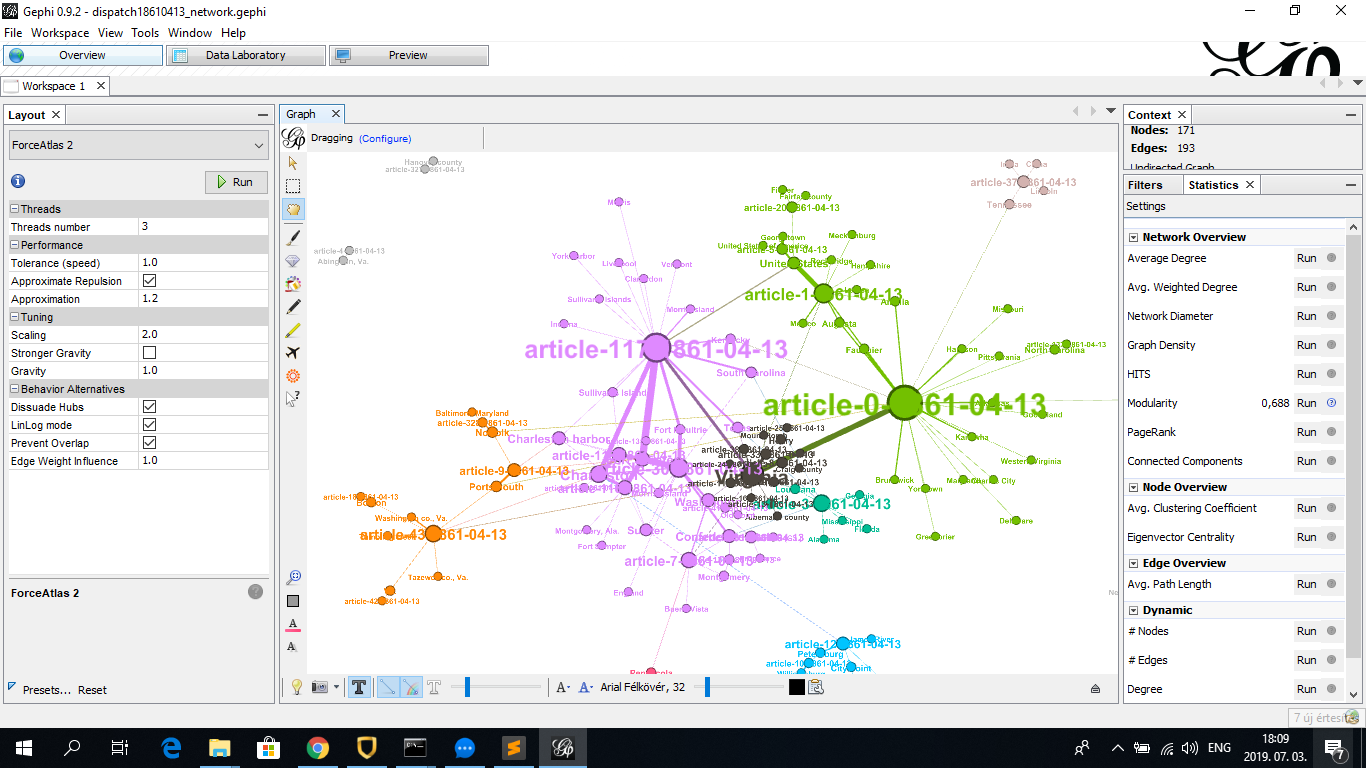
As it can be seen, with the exception of Virginia (center of dark cluster in the middle), the major nodes of the network are articles identified by an ID made up from a serial number and their publication date (which is always 1861-04-13 in this case. This is arguably because one article can include a relatively large amount of geographical locations. Among relatively larges nodes of geographical locations is Fort Sumter (also note its alternative form Sumter and misspelling Fort Sumpter, if these would be included in the same node, it would be even bigger), location of the outbreak of the Civil War, and the broader geographical areas where Fort Sumter is located, namely the Charleston Harbor and the city of Charleston (South Carolina):